When it comes to taking raw data and converting it into useful and impactful information then Excel is an incredibly helpful tool. An Excel dashboard is a place where you could track all your business’s important KPIs, metrics, and data points using visuals and charts. In short, visual representation of data is known as dashboard. It simplifies complex data and transforms it into something visually which is easier to understand.
From project management or budgeting or marketing or sale reporting, everywhere it plays an important role. A good financial analyst needs to be master in creating dashboard in excel. It is an important skill which one should know. Here in this tutorial guide, we will see how to create a dashboard in excel.

Import data into excel – First of all, to create your dashboard in excel you need to import data. You can simply copy-paste the data or you can take help of any external app to pass data in real-time. Data can be imported in two different ways: in a flat file or a pivot table. With the available data, set up an excel table on another tab. Recognizing the elements you want to add to your dashboard will help you group similar data together and give you an idea of the layout.
Dashboard layout - Once you are done with importing data into excel file, now you need to structure your workbook. Create two to three sheets in your workbook. Keep the first tab for dashboard and the other for raw data and table.

Organize data – When working with data, it is important to organize data in appropriate rows and columns. Clean-up the duplicate data to keep unique one to utilize the dashboard feature, otherwise you will be double counting.
Create table with raw data – Create table with the available raw data.
Analyze the data – Before you start to make dashboard in excel, take some time to look at your data and figure out what you want to highlight. Once you have an idea of your dashboard’s purpose, you can use different tools for analyzing data like –
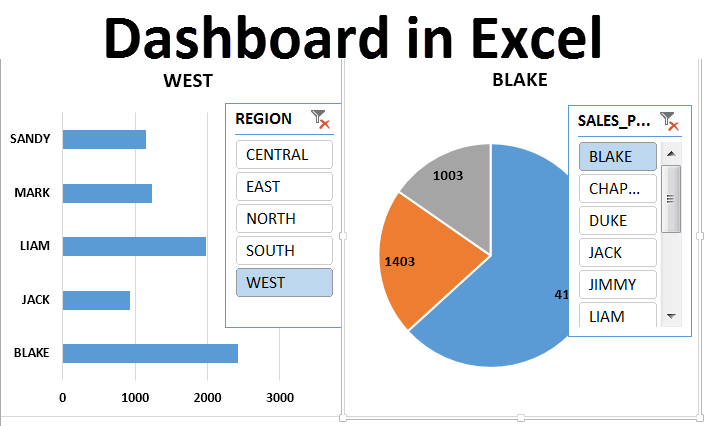
Create the dashboard – This process is all about inserting the charts and visuals on dashboard. With the different visual about data.
See the detailed video on Creating Excel Dashboard With Excel dashboard examples.

02 June, 2024

18 May, 2024

16 May, 2024

22 April, 2024

17 April, 2024

13 February, 2024